Quality issues in the field need to be identified and resolved quickly, to contain costs and also to maintain end-consumer satisfaction. Data-driven techniques are the most effective and efficient means to identify such issues rapidly because they provide an inexpensive, centralized solution, without the need to ship physical parts or have analysts travel. Quality issues may be found and tracked semi-automatically by setting up and interpreting appropriate alerts. Early notifications involve inherently complex methods to avoid false alarms while not missing important real issues. With experience and experimentation, combined with the means to set alerts on diverse data sources, useful early quality alerts are feasible.
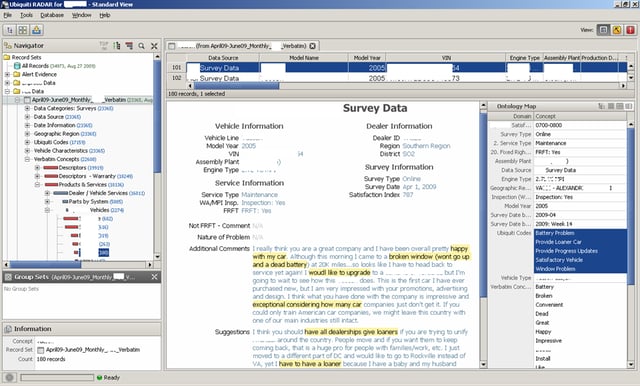
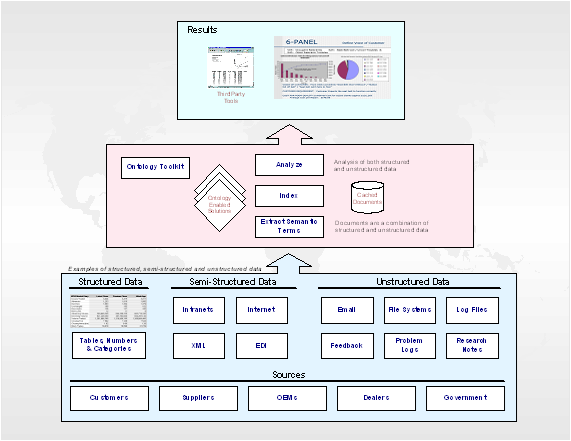
Initially, the available data and information obtained from multiple sources must be collated into formats more amenable to automated processing for analysis and alerts. Structured data (i.e., numeric and/or categorical) is usable with relative ease, but other data (e.g., open feedback collected from customers) may be unstructured and must be converted to structured formats. Verbatim text narratives are very useful, but they are a particularly difficult and complex data source to use automatically.

Appropriately configured software generates descriptors automatically for each record within a dataset, and these descriptors serve as surrogates for the record for further processing. As expected, the descriptors for each record represent a concise and accurate record of the contents. (Note that even if every record does not get precisely accurate descriptors assigned, a larger set of records still provides a statistically accurate ensemble for important tasks.) The descriptors are taken from a reference ontology (i.e., a set of concepts interlinked by semantic associations), sometimes configured in advance.
Raw data and information feeds arise from a variety of sources, and together, they enable useful means to identify quality issues and improvement opportunities. Examples of the sources include repair records, warranty claims, customer surveys, safety studies, internal manufacturing tests, external field tests, etc. Each source provides a different view on how various issues are emerging and playing out, but also, each source has its own data format and semantics associated with the values. Although the potential exists to utilize information from diverse sources to get a 360-degree view of issues, leveraging the diverse information sources is easier said than done.

The Actual Alerts
Once data from diverse sources has been converted into structured formats usable for further processing, various alerts may be set up to identify and track quality issues. The alerts may be as simple as a specific single instance of an issue (e.g., a problem that reoccurs after a correction for it had been implemented, referred to as a clean-date violation), to more complex control-chart-based tracking for spikes in issues. Also, alerts may be combined with complex pattern-mining of data, as exemplified in more detail below.
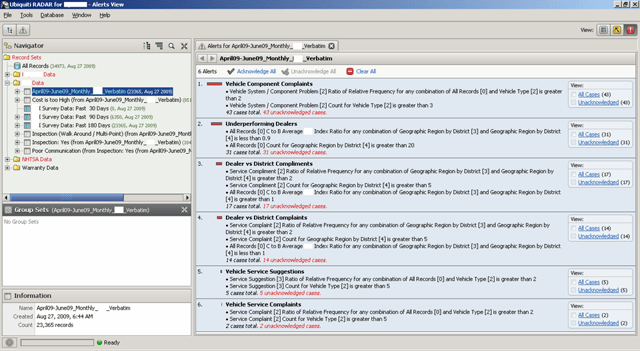
The setup of alerts may be facilitated by a software wizard, and the results triggered may be viewed by a ranked list. The reason that issue ranking is needed is that there may be numerous results, and it is best for the most important issues to show at the top. Usually, a numeric threshold is associated with an alert, and passing the threshold triggers the corresponding alert. Experience and experiments help determine the threshold values to use (i.e., too low a value results in many unnecessary alerts getting triggered, whereas too high a value may result in alerts not triggering for important cases).
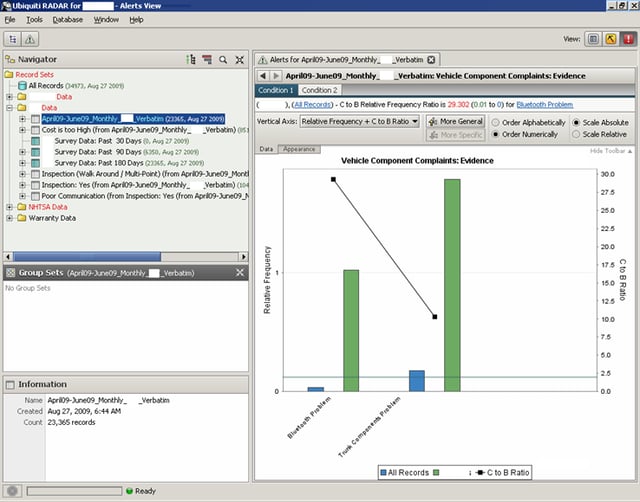
As an example of complex alerts, consider the following based on pattern mining on the data. The alerts are set up using a threshold on a function value involving two recordsets. That is, with a pair of recordsets x and y, we consider a function of interest f(x,y). For a designated threshold value t, if f(x,y) exceeds (or is less than etc.) the value t, then an alert may be triggered. Note that the main difference between alerts of this type and other alerts is a pair of recordsets in the former, rather than a single recordset.

As a simple example, consider a pair of recordsets consisting of Bluetooth parts (i.e., a comparator set) and an overall Electronics parts (the baseline set), where the Bluetooth parts could be a subset of the Electronics group. A simple function between the two sets could be parts-per-million (PPM); the intent is to monitor failure rates between Bluetooth and Electronic parts using PPM(Bluetooth,Electronics). And so, an alert may be set to trigger if, for instance, the PPM function value exceeds threshold 1.2 (i.e., the failure rate of Bluetooth parts exceeds that of the overall Electronics parts by 20 percent).
The above simple description may be generalized as follows:
- First, as in the case of simpler alerts, each threshold function may be stated as a condition within a more complex alert definition. The alert definition would consist of several conditions associated as conjuncts.
- Second, functions may include those applied to each pair of recordsets being compared as well as those applied to comparing distributions between a pair of recordsets. The former type of function is exemplified by the PPM measure discussed above, and the latter type of function is similar to gauging the difference between distributions of recordsets over a range of features.
- Third, the pairs of recordsets chosen could be universally quantified (e.g., as in predicate logic), as follows. Instead of being limited to a specific pair of recordsets x and y, all pairs x and y such that x in X and y in Y may be used for a designated set of recordsets X and Y. For example, assume that there are part groups for Moldings, Electronics, or Fasteners. In such situations, our approach enables setting alerts such that the threshold function f(x,y) triggers for (any one of) every pair of part x drawn from part group y. And thereby, an alert that has PPM(Part,PartGroup) would apply to each specific possible pair (e.g., Bluetooth and Electronics), and trigger an alert if any such pair meets the threshold value — and that same pair satisfies all the other conditions that have been set for the alert as well, of course.

Data needs pre-processing (e.g., to extract detailed information from messy verbatim text narratives), and the alert results need interpretation (i.e., to avoid false leads which wastes valuable time and resources). The diversity of data formats, values, and meanings — though difficult problems — are also common issues addressed by data systems. In contrast, the domain-specific issues of figuring out the right alerts to set (i.e., for tracking the possible quality issues) should be done by automotive domain experts. The role of computing and software is to provide a user-friendly system that enables experts to set appropriate alerts. Good user interfaces help define alerts and enable viewing triggered alerts; complex alerting capabilities should be supported by simple user interfaces.
About the Authors

Dr. Keith Thompson is involved with software and services at Ubiquiti and has two decades of experience in product design, process development, and quality control for several industries. At Ubiquiti, he leads the research, design, and development of its high-end information analysis technologies, and is the main technical liaison for client services. Formerly, he held senior technical positions at Ford Motor Company, and led the development of improved methods in design and manufacturing. He has pending patents, technical achievement awards, and numerous published papers.

Dr. Nandit Soparkar helps in business and technical development at Ubiquiti. As a former tenure-track professor in the College of Engineering at University of Michigan, he has advised start-up software companies, several now within publicly traded companies. He has published research in time-constrained transactions, data mining and analytics, and logic-enhanced hardware memories. He received the National Science Foundation Career (i.e., Presidential Young Investigator) Award and worked at AT&T Bell Labs and IBM Watson Research Center. He has published and pending books, patents, papers, and has peer-reviewed research efforts.


